I’ve been doing some social media work for clients lately, and I came across the Facebook page of a client’s competitor. I looked at several of the Facebook posts on the page and was really impressed by the number of likes and shares those posts received. I figured that those posts really resonated with this brand’s target audience—until I looked at the individual people sharing the posts.
I realized that all of the profiles were fake: they were all created for the exclusive purpose of sharing brand posts.
I tell this story because it’s an example of how easy it is to be deceived by vanity metrics like Facebook likes. Likes can be gamed, yes, and they also fail as a measurement because they don’t tell you how many people see the content you post. Just because a Facebook page has 4,000 likes doesn’t mean 4,000 people see the page’s content (thank you, EdgeRank). Sure, likes can be great for social proof and they can intimidate your competitors, but when it comes to tracking social media marketing efforts, we can all dig a lot deeper than Facebook likes or number of Twitter followers.
So what are we digging for? Facebook, Twitter, and Pinterest have built-in analytics. I’ll talk about what metrics within those analytics can be helpful and valuable for tracking, analyzing, and further developing your social media marketing efforts. I’ll also mention an awesome third-party tool.
I’m going to break things down by site.
Let the geeking out on data begin!
Twitter Analytics
Twitter debuted analytics in June, so it’s not as fully developed as Pinterest Analytics or Facebook Metrics, but there are some helpful stats on clickthroughs in there. To access analytics for your Twitter profile, go to ads.twitter.com and log in. You’ll see an Analytics option at the top of the screen. Click on it, and then click Timeline Activity in the dropdown.
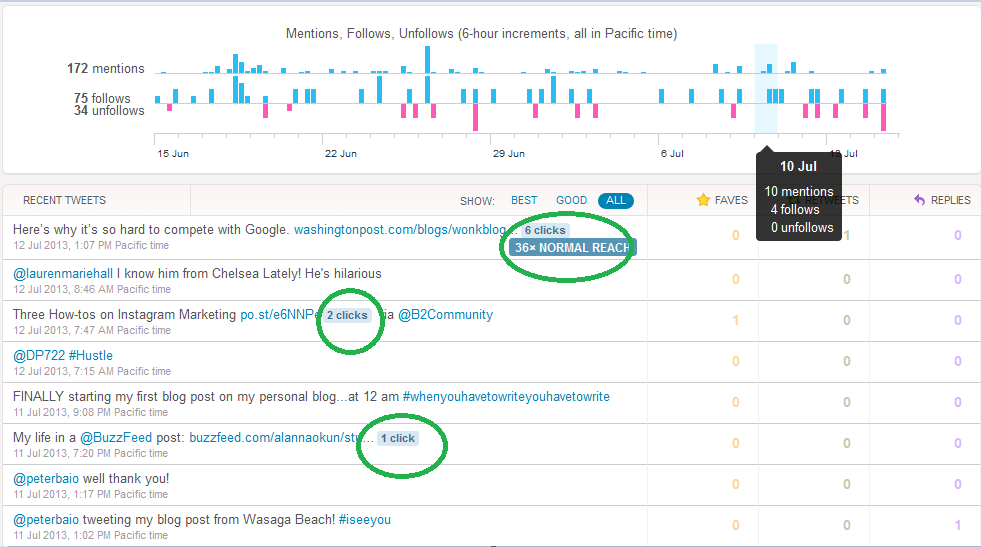
You’ll then see a screen that looks like this:
The top part shows you the number of mentions, follows, and unfollows you’ve had each day for the past month (though it won’t tell you who unfollowed you). I think the most helpful data is under Recent Tweets. You’ll see the faves, retweets, and replies for each of your tweets, and you’ll also see the number of clicks that links you’ve tweeted have received. (If you tweet the same link more than once, that number represents the total number of clicks, not just the clicks received from a particular tweet.) I can see this data on clicks being really helpful for writing blog post titles and figuring out which tweets drive clicks. If your tweet consists of the title of your blog post and a link, people obviously clicked on that link because the title captured their interest. It could be interesting to keep track of which links get the most clicks and see if there are any common patterns: Do how-to posts get more clicks? Do list posts get more clicks? Do tweets with @ mentions get more clicks? Experimenting with different titles could help you get more traffic from Twitter to your blog.
You can look at all of your tweets, or you can break them down further and look at the top two-thirds of tweets or the top 15% of tweets.
A great third-party tool for delving deeper into Twitter analytics is Followerwonk. It’s a Moz app, and you do need a PRO subscription to use many of the features, but you can use many for free. One of my favorite aspects of Followerwonk is the feature that lets you measure yourself against your competitors. If you go to followerwonk.com and sign in with your Twitter account, you’ll see a tab that says “Compare Users.”
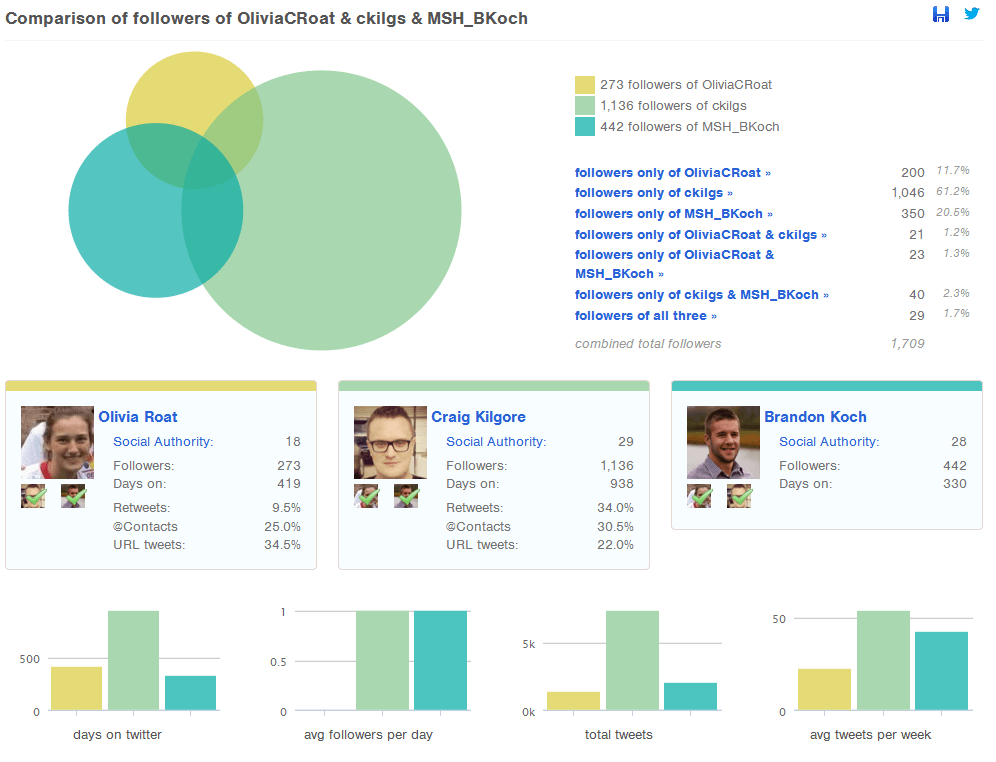
You can compare yourself against up to two people, and you can compare either those Twitter users’ followers orthe users those people follow. I decided to see how my followers stacked up to the followers of two of my coworkers, and here’s what I got:
You can see that there’s a lot of data here: it shows any overlap amongst our followers, average followers per day, retweets and mentions as percentages of timelines, all of which will get at how people engage with you on Twitter vs. how people engage with your followers. It puts things in context: how do I stack up against people in my industry? Followerwonk also assigns every Twitter user a social authority score, a number on a 1-to-100-point scale that measures a user’s influential content and goes beyond vanity metrics.
Followerwonk will also analyze your Twitter followers (just go to the Analyze Followers tab): it breaks down my followers by location and it shows me at what time of day my followers are most active. I can then use this data to tweet at certain times and thereby reach more of my followers.
I can also get detailed info about my followers. Followerwonk breaks down my followers by social authority score. It not only tells me that 1.8 percent of my followers have a social authority score from 71 to 80, but it also tells me exactly which Twitter followers have that score. All of this data gives more meaning to your follower count. If someone has a lot of Twitter followers, but most of those followers are inactive or use Twitter solely as a broadcast platform and never interact with others, that large number has very little substance behind it. If someone has cultivated a relatively small but active following, that means something. With Followerwonk, rather than just knowing that I have 270+ Twitter followers, I know that I have 270+ Twitter followers and 5 of them have follower counts between 50,000 and 100,000; 100 of them have tweeted in the last hour; 50 of them regularly consume others’ tweets because retweets are 25-50% of their timelines, etc.
Facebook Insights
Facebook also has built-in analytics called Facebook Insights. If you’ve never really spent time looking at the Insights for your page, it can all look veryyyy overwhelming (and that’s an understatement). But Facebook recently rolled out new Insights, so the data is more meaningful and easier to understand (the new Insights debuted in June to a small group of beta testers, and I just got access a few days ago).
Some of the data Facebook gives you relates to your page’s performance, like your total page likes. While that can be helpful (for instance, if your likes are drastically decreasing, you need to notice and address that), I think post-level data is more helpful because it helps you really zero in on the content you create for and post on Facebook. Seeing how individual posts were received by your audience lets you tailor future posts around your top-performing content.
You can look at a visual representation of the data right in the Insights section on Facebook. Go to the Posts tab and then make sure you’re looking at All Posts.
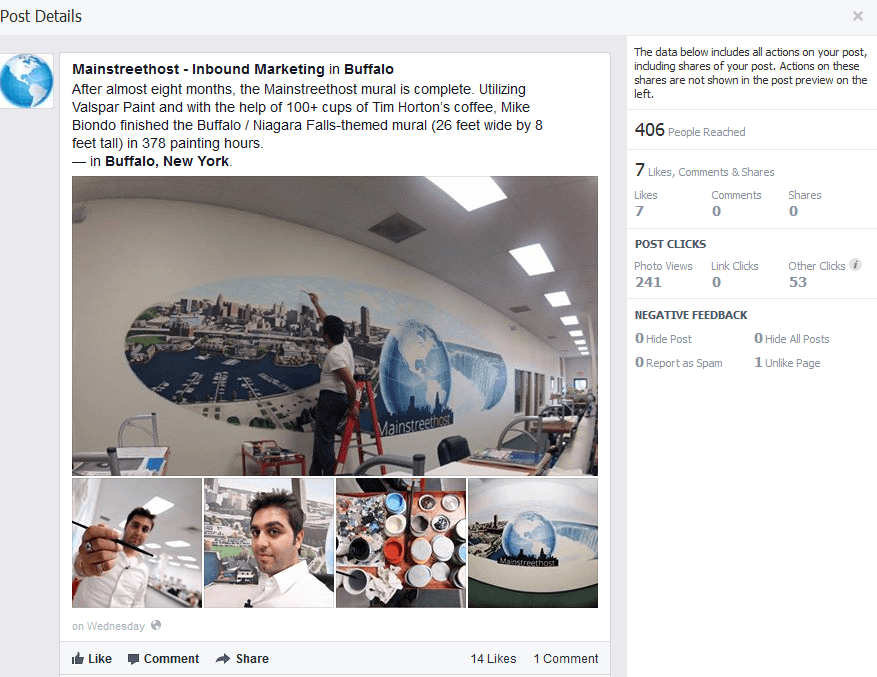
Here’s the info for a recent post on the Mainstreethost Facebook page.
Reach is the number of people who have seen the post (that number is for the first 28 days after a post is published, and it includes both desktop and mobile user if the post was published before July 2, 2012).
Facebook lets you break your reach down into organic/paid reach and into fans/non-fans (just click the drop down next to Reach and choose the Organic/Paid option or the Fan/Non-Fan option). Remember that EdgeRank determines which of your posts show up in the news feed of individual users. Because of EdgeRank, the more that people interact with your brand posts, the more likely it is that they will see your posts in their news feeds. And the more negative feedback your posts receive, the less likely it is that people will see those posts. EdgeRank tries to give people valuable, relevant content in their news feeds. Organic reach can help you get at the level of quality of your posts because EdgeRank rewards quality posts with better reach.
But with reach, there’s still the possibility that people saw your post but didn’t take any action or didn’t really pay attention to it. That’s why you want to look at engagement rate (what was virality in the old Facebook Insights). Engagement rate is the percentage of people who liked, commented, shared, or clicked on your post after having seen it. This gives meaning to not only your reach numbers but also to your People Engaged number. If you click on the drop down next to Post Clicks/ Likes, Comments, & Shares, you’ll see the Engagement Rate metric.
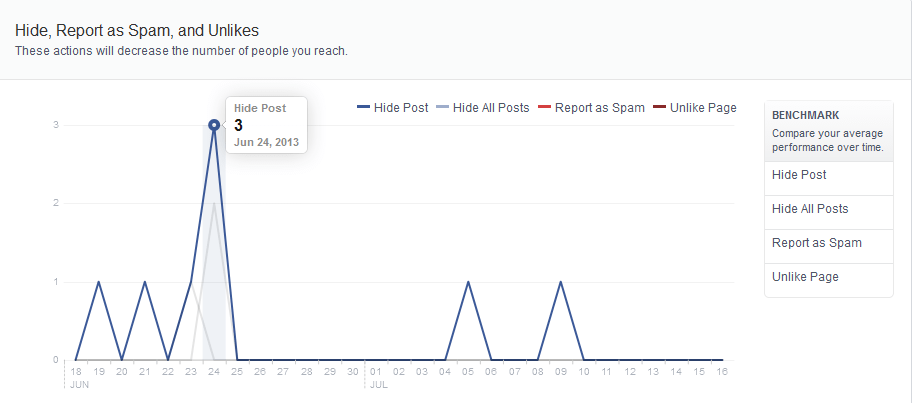
And conversely, you also want to look at any negative reactions your posts receive (again because of EdgeRank). You can see that by clicking Post Hides, Hides of All Posts, Reports of Spam option from that same drop down. If you’re visually inclined (me!) and want to see increases and decreases in negative reactions over time, you can do that too. Go to the Page tab and then look at Post Reach.
Scroll down and you’ll see a graph.
I see that on June 24, three people hid a post from the Facebook page. I click on that little “Hide Post” message, and I can see which posts were published on that day. What did I publish that made people want to hide the post? This will help me when I’m creating posts in the future.
And each individual post has what Facebook calls a “score card,” which basically lists all the data available for that post in one place.
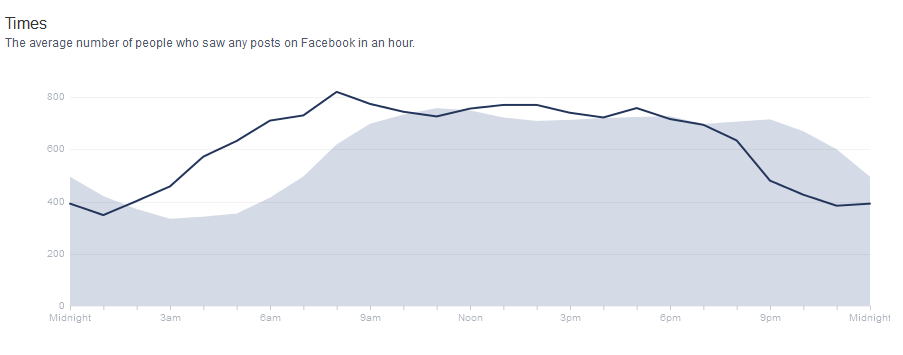
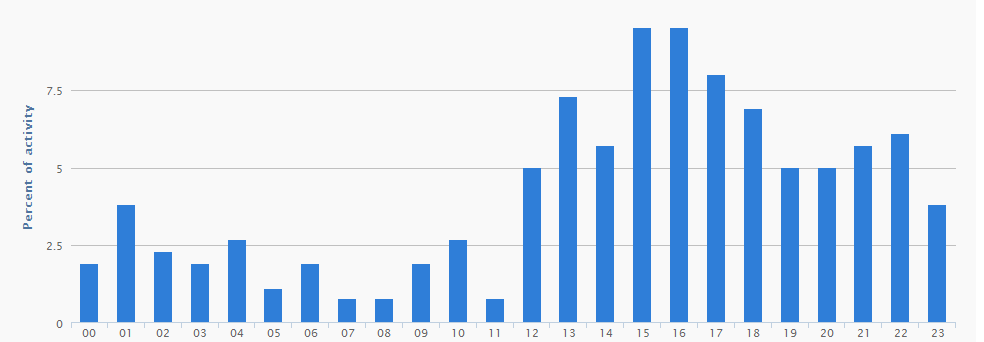
Finally, Insights also tells you what time of day your fans saw your post. I’m sure you’ve read countless reports of studies that try to pinpoint the best time to post on Facebook or the best time to tweet. The problem with these studies is that they always come to different conclusions, and these generalizations may not be applicable to your audience. That’s where Insights comes into play. It shows you the number of fans that saw your post at any given hour over the course of the week. Just go to the Posts tab and then click on “When Your Fans Are Online.”
Exporting Data
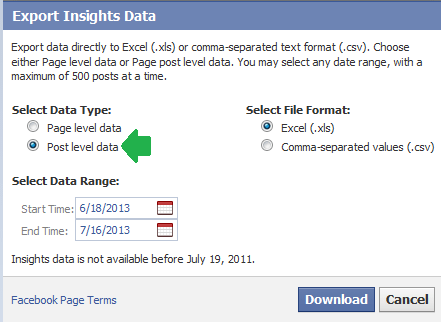
There’s a lot to see within Insights, and there’s even more to see if you export data to Excel. Again, I think post metrics are more helpful than page metrics. When you click the Export Data button, you can export solely post metrics by selecting the “Post level data” option.
When you export, you’ll get columns and columns of data for each post (22 at my last check). Most of it you don’t need because a lot of it amounts to vanity metrics. What you ditch and what you look at closely is going to depend on the goals of your Facebook marketing efforts, but I do think that regardless of your individual aims, some metrics are way more helpful than others.
The columns that I think you can do without:
- Lifetime People Talking About This– before the new Facebook Insights rolled out, Facebook lumped everything from someone liking your page to posting on your wall to checking in to your business in the People Talking About This metric. But with the new Facebook Insights, these various actions are reported separately, so you’re much better looking at the separate stats right on your Facebook page than looking at this ambiguous metric in Excel.
- Lifetime Engaged Users– this tells you the number of people who clicked anywhere in your posts, which sounds valuable, but it’s actually more helpful to look at the engagement rate on Facebook because the rate gives meaning to the number of people who interacted with your post by calculating the percentage of people who engaged with it after they saw it. This is a much better measurement for gauging the appeal and quality of your content.
Pinterest Analytics
Pinterest introduced analytics back in March, and analytics are accessible only for Pinterest business accounts (if you didn’t join Pinterest as a business from the get-go, no need to worry. You can simply convert to a business account).
Once you have a Pinterest business account, to get access to Pinterest Analytics you have to do two things: verify your website and switch to the new look.
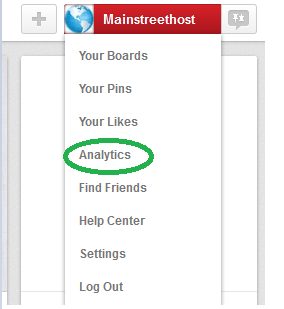
After you’ve done both those things, just click on the profile pic/icon in the top right-hand corner of the page and you’ll see an Analytics option.
Pinterest Analytics has four tabs: Site Metrics, Most Recent, Most Repinned, and Most Clicked.
#1 Site Metrics
What it shows:
- Number of images that have been pinned from your website
- Number of people who have pinned images from your website
- Number of your pins that have been repinned
- Number of people who have repinned your pins
- Impressions (number of times your pins appeared on Pinterest in the main feed, in search results, or on boards)
- Reach (number of people who saw your pins)
- Clicks (the number of clicks that came to your website from Pinterest)
- Visitors (number of people who came to your website from Pinterest)
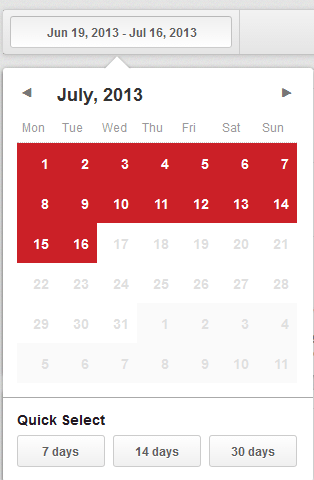
Pinterest will show all of this data over time on graphs. You can view the data for any date range you choose, just like you can with Google Analytics (though the last time I checked, you can’t look at stats before November 2012).
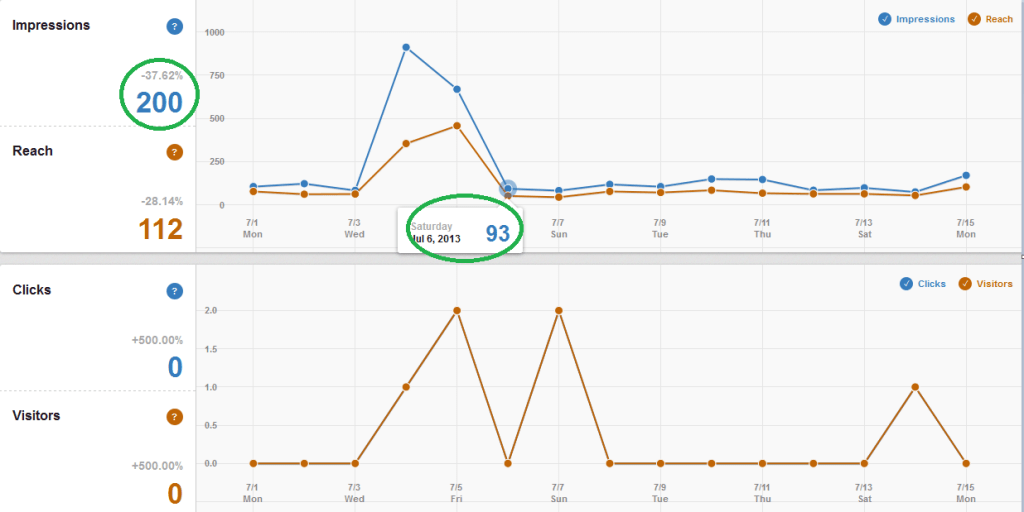
The Site Metrics tab is composed of graphs like these:
The large blue numbers represent the daily average number of actions for the date specified. The large orange numbers represent the daily average number of people who performed those actions for the date specified. You’ll see the percent change over time too. If you hover over any of the points, you’ll see the number for that specific day.
#2 Most Recent
This tab shows you which of your pins have recently been repinned by users.
#3 Most Repinned
See which of your pins have been repinned the most. You can specify the date range for this tab, so you can look at which pins were most popular at a given time.
#4 Most Clicked
See which pins drive the most traffic to your website. You can specify date ranges on this tab too.
How to Use This:
Like Facebook Insights, Pinterest Analytics lets you export data to Excel. But I actually think it’s more helpful to have a visual representation of the data than to have a spreadsheet. You want to look at the number of repins because when people repin your content, they expose it to a larger audience (the reach number will show you exactly how large that audience is). Look at the repin graph on the Site Metrics tab in conjunction with the Most Repinned tab. If you see increases in the number of repins on the graph for a certain date, see which of your repins were most popular for that date. Those pins clearly resonated with your audience. What’s unique about them, and what do your most repinned pins have in common? You can use this info to tailor your future Pinterest marketing efforts.
You want people to engage with you on Pinterest, and you also want people to take initiative and pin images from your site. Pins and repins expose your content to other users’ followers. Do you have a Pin It button on your site? If not, you may want to consider one because it encourages people to pin your visual content. And if you do have a Pin It button on your site but you see that people aren’t pinning, you may want to consider adding more images or taking a look at the types of images you have on your site (maybe they’re not interesting or visually compelling enough to prompt people to pin).
And finally, the clicks and visitors metrics are key because one of the aims of Pinterest marketing is to drive traffic to your site. Look at these metrics and the Most Clicked pins: what kind (or kinds) of pins motivate people to click through to your website. Are they gorgeous images? Do they have helpful information? Again, this is all important info that you can base marketing efforts around.
Connecting Social Media to Sales
So what I’ve talked about here is how to use built-in analytics to tailor the content you create and promote on social media sites. But social media should contribute to your sales funnel too. In my next blog post, I’m going to delve into how to set goals and track conversions using Google Analytics and how to use UTM parameters.






Great article! But has Twitter analytics disappeared already? I used it the last two months but it doesn’t seem to be there any more.
leighgreendog Glad you liked the post! Twitter Analytics is working for me right now, but it looks like Twitter has changed a few things since I wrote this (the Followers tab & there’s a Website tab now too). The beauty of working in a quickly evolving field I guess 😉